One of the fundamental principles that a member agrees to when joining a CSA is that they are most likely paying in advance for their food. Based on the principles of accrual accounting, the cash that you receive before you deliver your goods is considered unearned revenue. Once you deliver your produce to your members, the value of that delivery is then recognized as earned or realized revenue.

The Past Deliveries ($) report provides you with a monthly breakdown of earned revenue by Members, Producers, Locations and Items. To learn more about the Past Deliveries ($) report, click here.
How does Farmigo charge for its services?
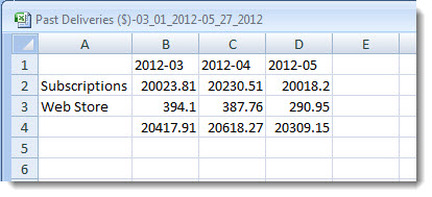
Farmigo calculates its monthly service fee based on total earned revenue between the first and last day of the previous month. This calculation includes subscriptions and web store orders. We will send you an invoice for the past months deliveries between the 5th and 10th of the current month. You will have one week to review your invoice before you are charged.
Where do members spend money?
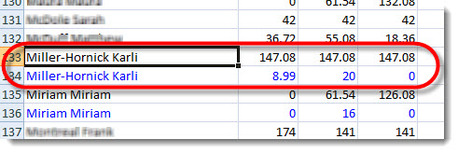
When you breakdown the report by Members, you will see how much revenue has been earned from a member's subscriptions versus web store orders. To help you compare these figures, I recommend shading the values of web store orders blue; then sort the data by member names. You will be able to see how much a member spends at the web store in relation to how much they spend on their subscription.
What trends can I identify?
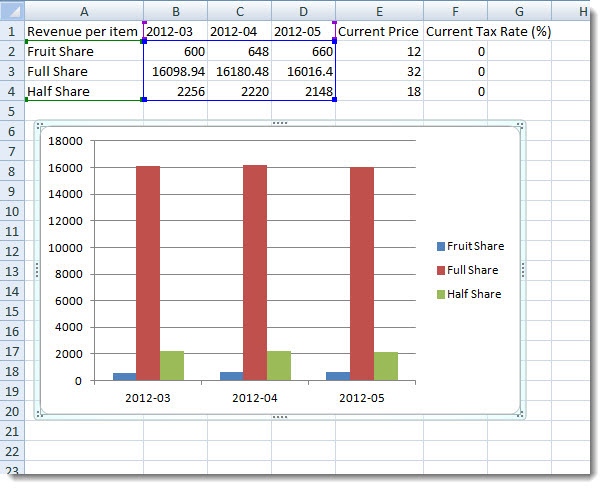
When you generate breakdowns by Producers, Locations, or Items, you will be able to identify other interesting trends. For example, perhaps you would like to understand which share generates the most revenue each month. Generate the Past Deliveries ($) report, breakdown by Items. Open the CSV file in a spreadsheet program, such as Microsoft Excel. Delete the item rows that are not relevant, select the data, and insert a column or bar graph. This will provide a clear visual of where you are earning the most revenue.
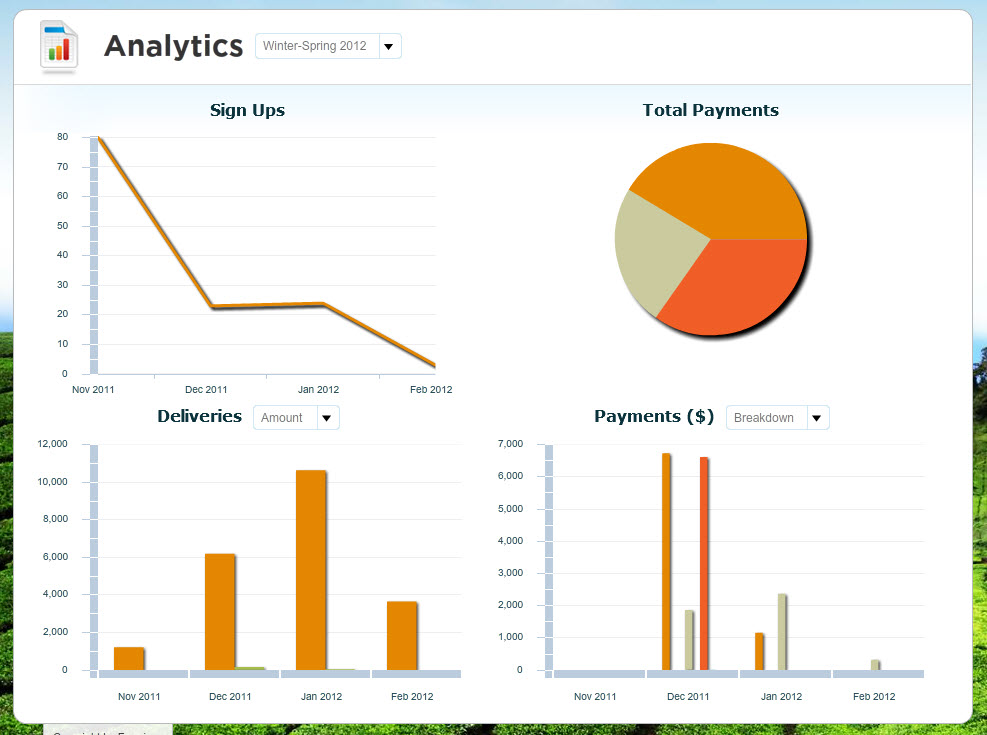
For a snapshot of current trends related to your CSA, check out the Analytics listed under the Status menu in your Dashboard.
What are some interesting trends that you have discovered?